ImageLab
Hyperspectral Image Processing Software for THz Imaging Data

Unique Image Processing
Statistical methods for THz and spectroscopic image analysis
Flexible Data Import
Supports diverse input formats for seamless workflows
Comprehensive Pre-processing
Covers filtering, normalization, and baseline correction
Advanced Visualization
Generates clear, detailed, and customizable image displays
Highlighting of Information
Emphasizes relevant structures and spectral features
Specifications
Basic Edition | Extended Edition | Database Edition* |
Detection of suspicious pixels | 4D data model | User-definable spectral databases |
Image stack | 64-bit architecture | Support of third-party databases |
Basic set of mathematical methods | Multi-sensor support | Library search |
Vertex component analysis | ImageLab script automation | |
Principal component analysis | KNN classifiers | |
Cluster analysis | Random forest classifiers | |
PLS discriminant analysis | Multiprocessing support | |
Similarity maps | ||
Baseline correction | ||
Spectral descriptors | ||
3D image display | ||
Maximum noise fraction transform |
- *Coming soon
Options

For THz imaging applications our fully automated extension TERA Image can be integrated.
Data
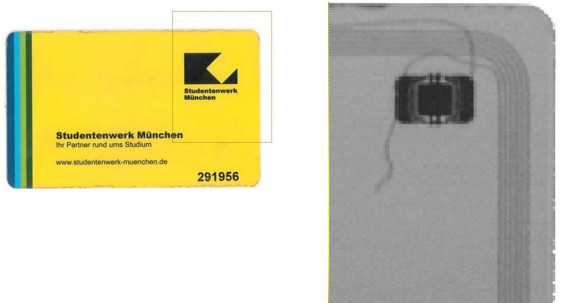
Photo and transmitted THz signal distribution, selected for the spectral range of 1.5 – 2.5 THz:
The microchip, antenna windings, and the wiring are visible due to the increased image resolution of the high-frequency range.
K-means cluster analysis ClassMap (k = 8):
The k-means algorithm breaks down the input data set into k partitions (culsters). The picture below shows an automatic analysis of the 0.7 – 2.1 THz region. Due to different diffraction of linearly polarized THz radiation the vertically and horizontally oriented structures of the antenna induce different spectral properties. The different material components of the key card such as plastic, semiconductor chip, or metal are clearly recognized.
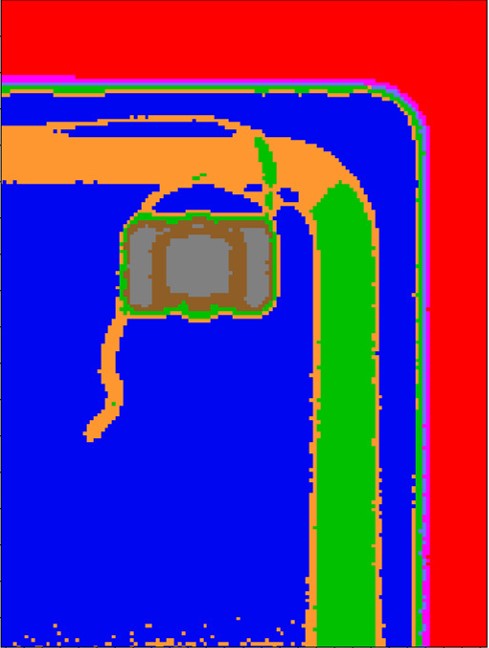
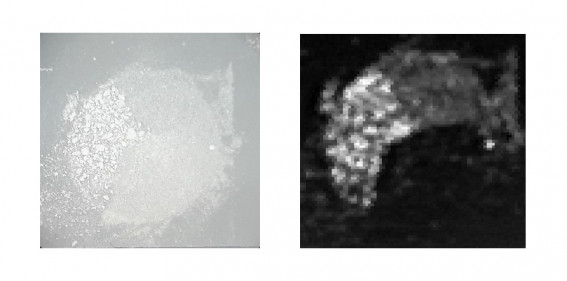
Photo of a sample consisting of three different biomolecules, α-lactose, L-tyrosine, L-glutamine, and transmitted THz signal distribution, filtered for the range of 1.5 – 2 THz: Despite comparable thickness of each layer, the different sample regions exhibit different transmission intensity.
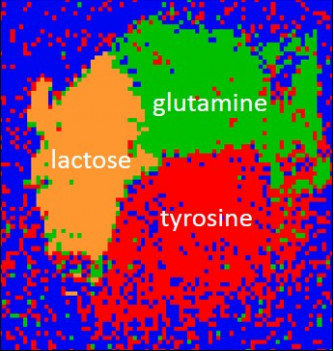
K-means cluster analysis (k = 4):
The algorithm uses the significant spectral components of the three substances for their identification and maps their occurrence within the mixture.
Our Expert
Ordering Information
Product Code:
ImageLab