TERA Image
THz Imaging Tool with ImageLab Processing Software
Specifications
Advanced Features and Benefits
- Including ImageLab, one-of-a-kind image processing tool for data analysis and visualization
- Automated measurement
- Flexible setting of travel range, speed and pixel increment
| Travel range | 150 mm x 150 mm and 300 mm x 300 mm (ask for longer ranges) |
| Resolution x-direction | <250 µm* (stage resolution < 10 µm) |
| Resolution y-direction | <250 µm* (stage resolution < 10 µm) |
|
Travel speed: TERA K15 TeraSmart |
>30 (up to 40) data pixels/second |
|
TERA ASOPS |
up to 100 data pixels/second (ask for fast imaging option) |
*image resolution is limited by the size of the THz focal diameter
Description
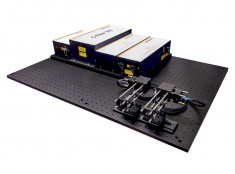
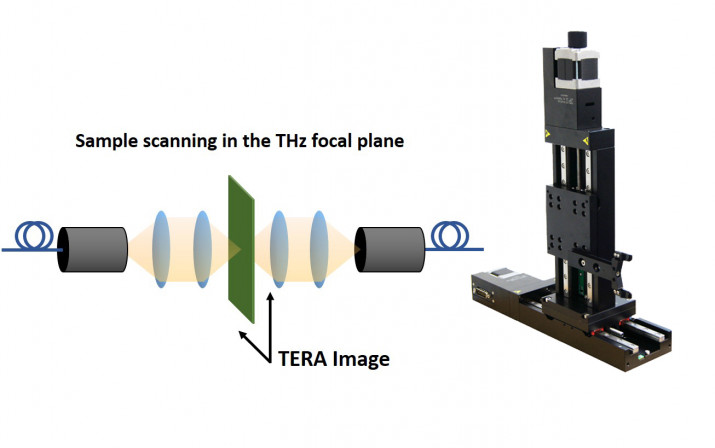
Menlo Systems’ TERA Image is an automated imaging unit which can be upgraded to our THz time-domain spectroscopy systems. It enables the user to acquire THz images in transmission or reflection geometry. The measurement sample is mounted onto the unit and placed into the focal plane of the THz path. The image data then consists of a matrix containing the entire spectral information for each data pixel of the scanned X-Y-plane, with a total range of 150 mm x 150 mm or even larger.
The real strength of TERA Image lies in the analysis and visualization of the image data. It uses EPINA’s ImageLab software for image reconstruction and analysis, with various functions for data processing, classification, or merging with maps of physical properties. With this unique tool the TERA Image is a powerful THz imaging system for a large variety of applications.
FREE trial license of ImageLab available here.
Options
-
ImageLab: Extended Edition THz Image Analysis
Product Code: ImageLab

Hyperspectral Image Processing Software for THz Imaging Data
Antenna and chip structure in a key card
Photo and transmitted THz signal distribution, selected for the spectral range of 1.5 – 2.5 THz:
The microchip, antenna windings, and the wiring are visible due to the increased image resolution of the high-frequency range.

K-means cluster analysis ClassMap (k = 8):
The k-means algorithm breaks down the input data set into k partitions (culsters). The picture below shows an automatic analysis of the 0.7-2.1 THz region. Due to different diffraction of linearly polarized THz radiation the vertically and horizontally oriented structures of the antenna induce different spectral properties. The different material components of the key card such as plastic, semiconductor chip, or metal are clearly recognized.

Identification of biomolecules
Photo of a sample consisting of three different biomolecules, α-lactose, L-tyrosine, L-glutamine, and transmitted THz signal distribution, filtered for the range of 1.5 - 2 THz: Despite comparable thickness of each layer, the different sample regions exhibit different transmission intensity.

K-means cluster analysis (k = 4):
The algorithm uses the significant spectral components of the three substances for their identification and maps their occurrence within the mixture.


-
Dr. Milan Öri
Your direct line to our expert
Data sheets
Product literature
Ordering information
- Product Code
- TERA Image
Headquarters
sales@menlosystems.com
+49 89 189166 0
Menlo Systems, Inc.
ussales@menlosystems.com
+1 973 300 4490